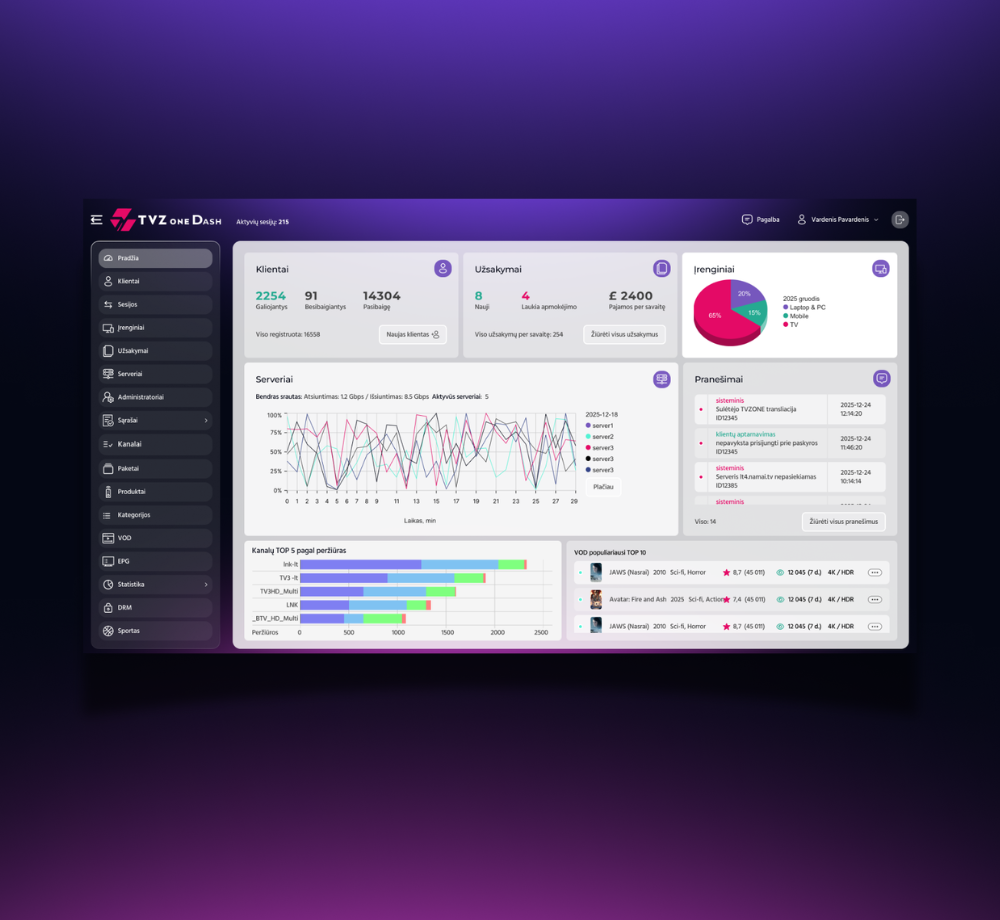
TV Zone (TVZ one Dash) was a massive, enterprise-grade front-end development initiative focused on engineering a complex, data-heavy admin dashboard completely from scratch using vanilla web technologies — HTML5, CSS3, and pure JavaScript. Following a strict architectural constraint, the entire system was built without a single external library or framework: no Bootstrap, no Tailwind, no React, and no third-party charting or modal dependencies.
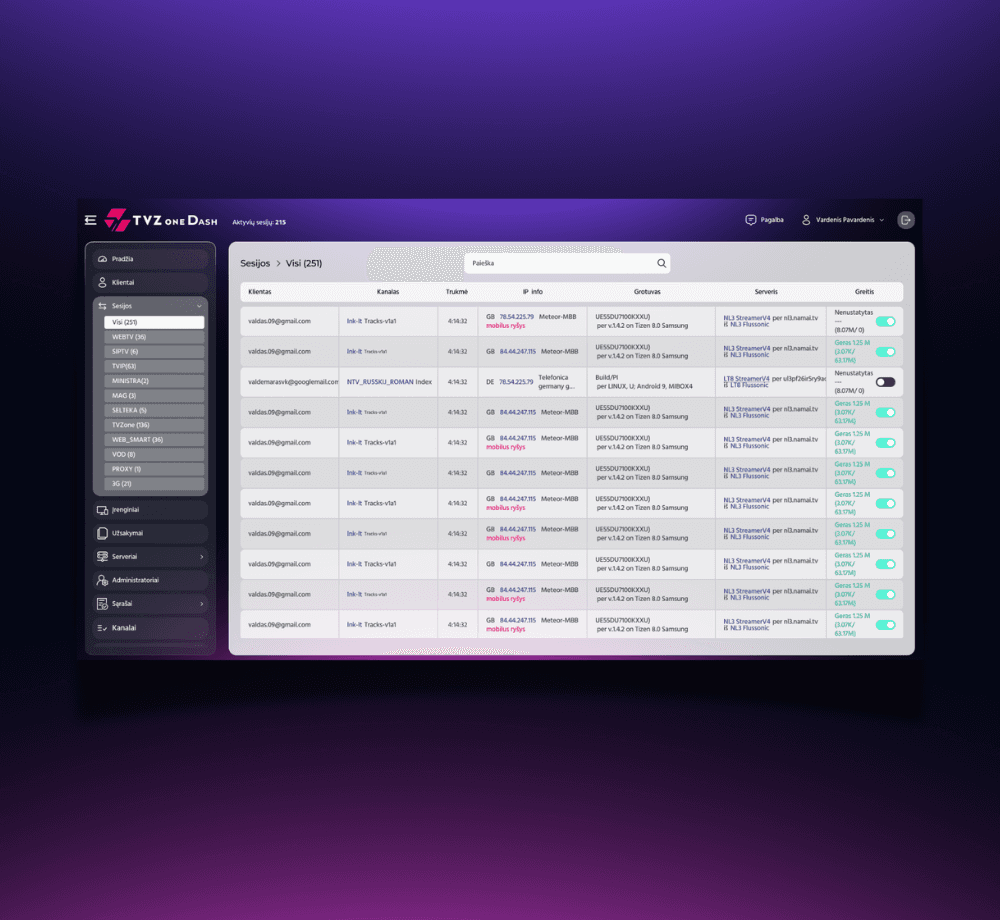
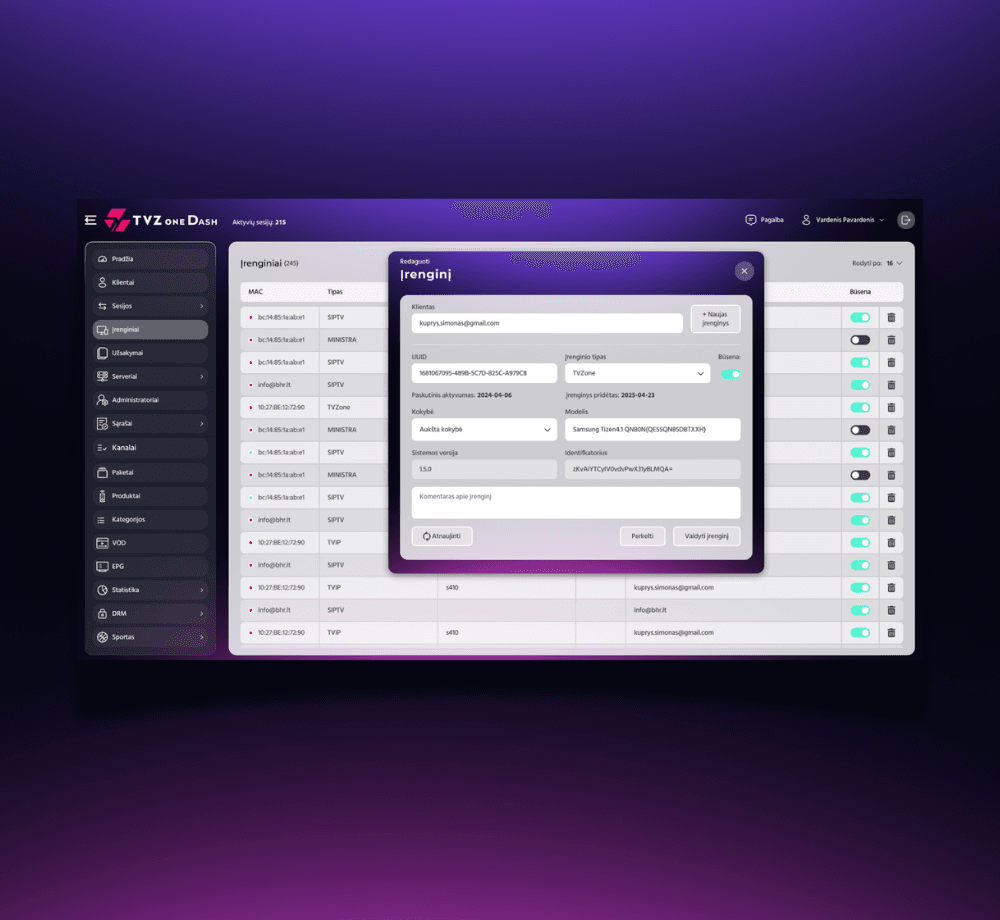
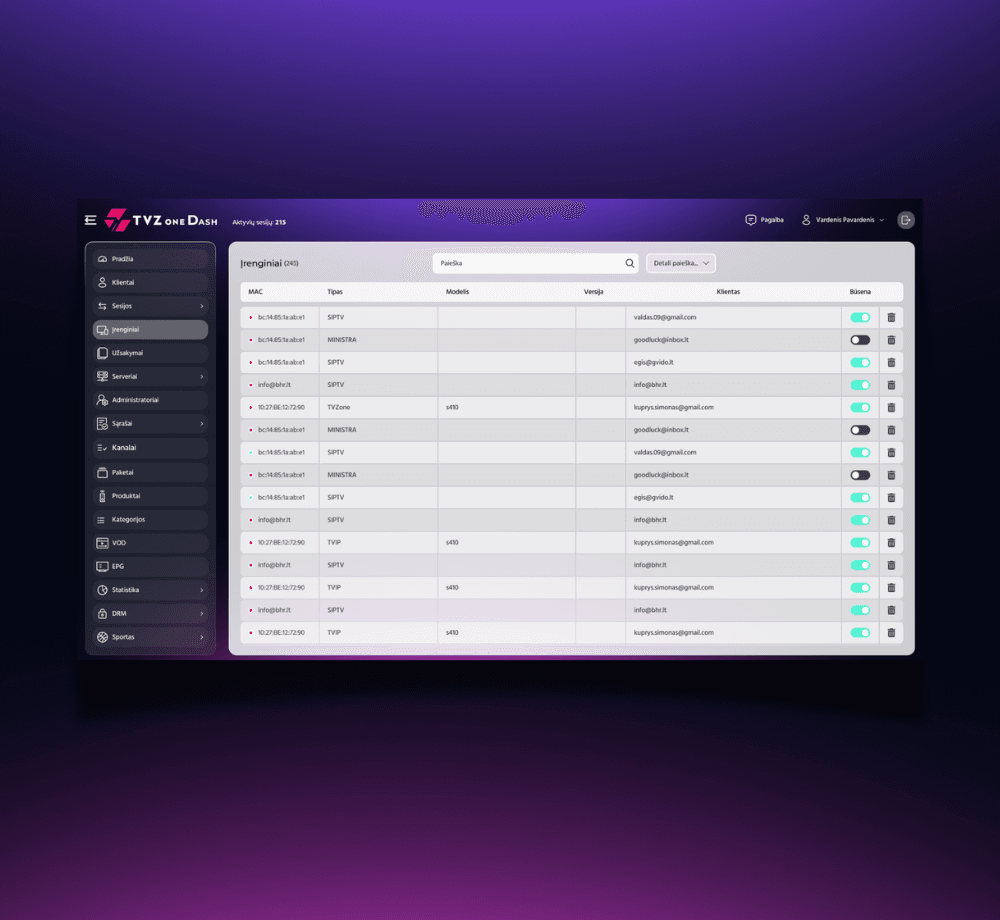
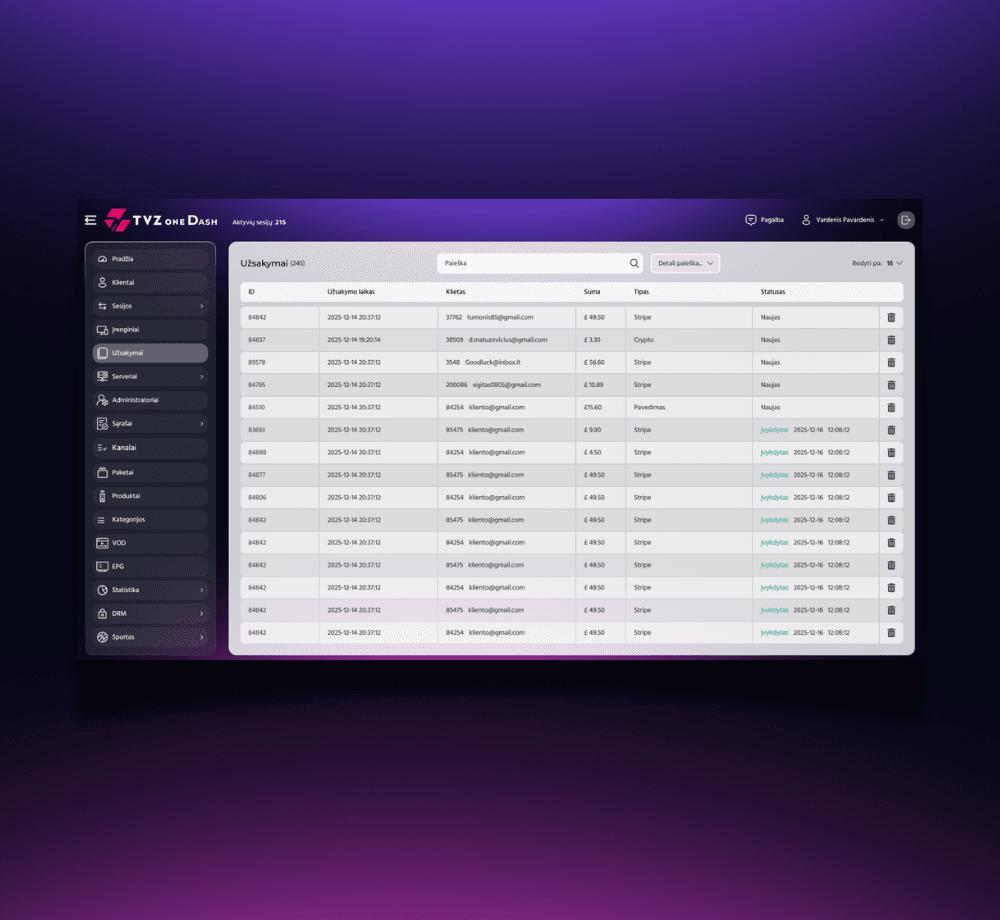
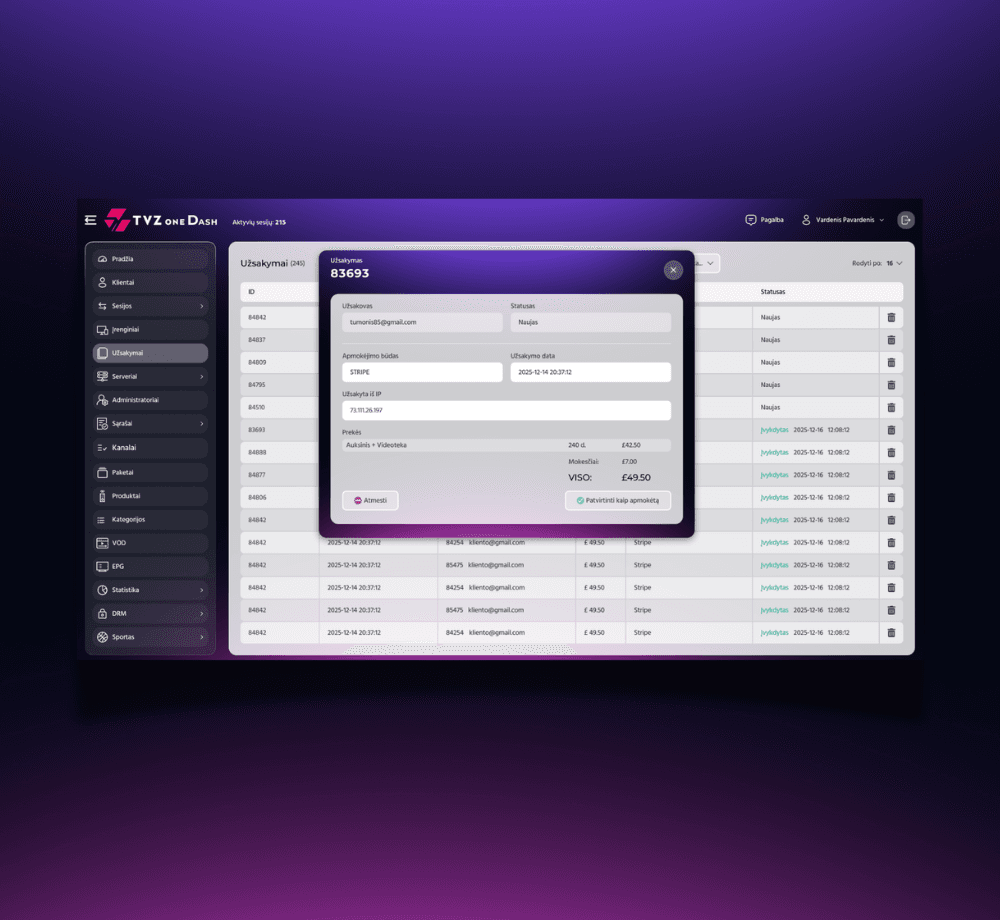
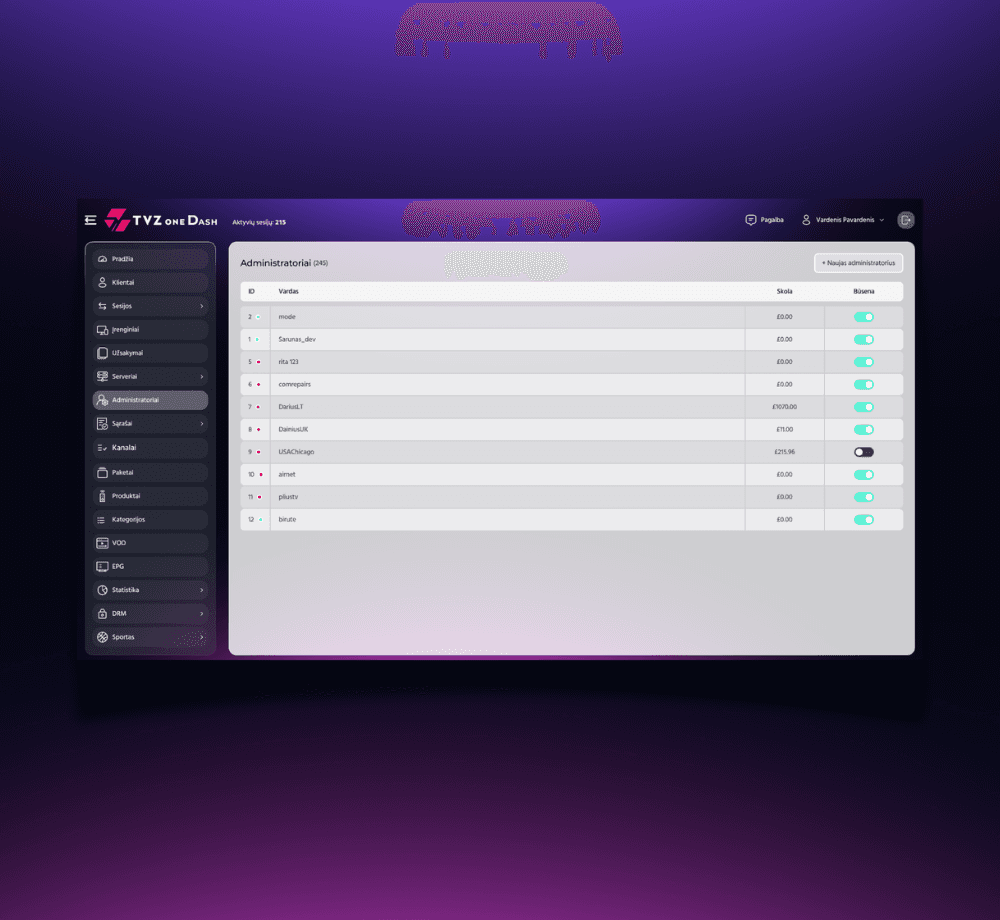
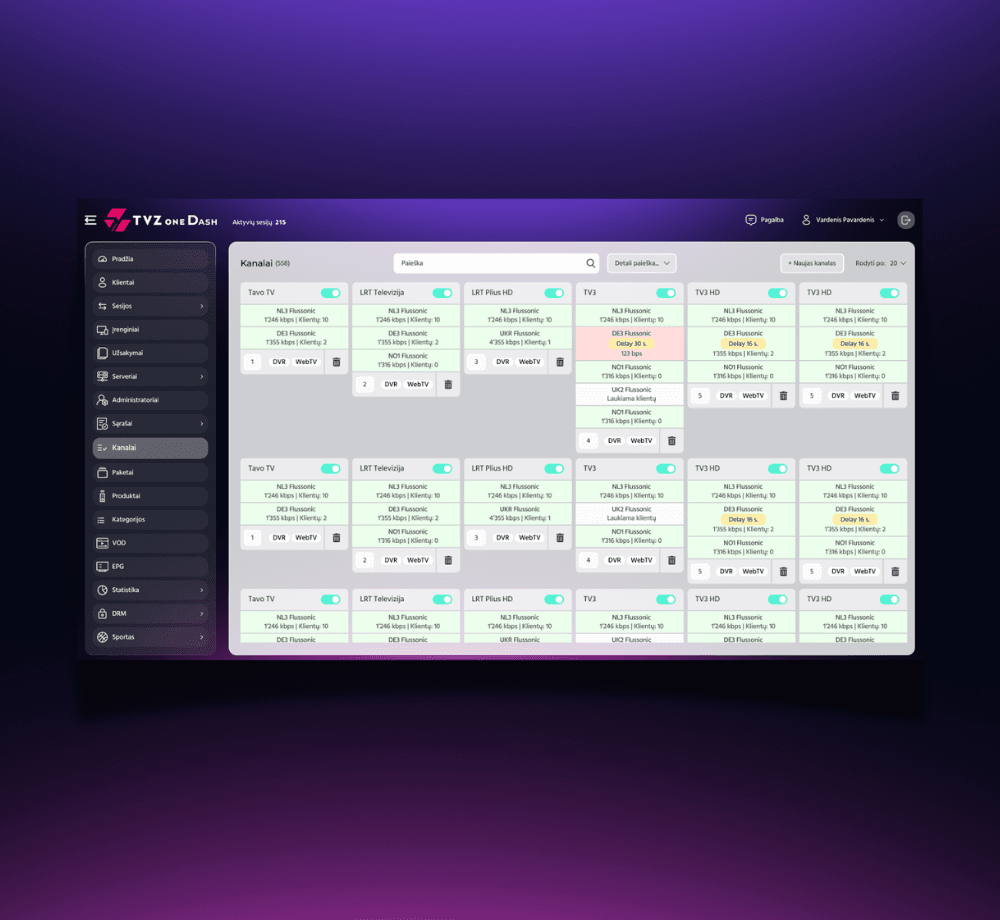
Spanning over 60 pages and interactive screens, the system was translated directly from a comprehensive Figma design with pixel-perfect precision and complete fluid responsiveness across every screen size. The dashboard manages the full lifecycle of an IPTV/streaming platform — clients, devices, sessions, orders, servers, channels, VOD content, live sports, and analytics — through persistent sidebar layouts, state-driven authentication flows, multi-layered draggable modal windows, and native JavaScript DOM-driven CRUD matrices.
The Issue At Hand
During the research phase, it became clear that opening multiple modal windows at once risked stacking context glitches, broken z-index positioning, and frozen UI windows if left unmanaged, since the project's strict no-library rule ruled out any off-the-shelf modal or window-manager package.
Rendering vector data — bar charts, line graphs, and pie charts — without libraries like Chart.js or D3 required deep analytical layout math to convert raw data integers into percentage values relative to a fixed element box height, then drawing scalable graph bars and points with pure CSS and JavaScript.
Managing style consistency across 60 sprawling screens translated directly from Figma also surfaced the need for a systemized approach: without a global variable matrix, font hierarchies, line heights, colors, and layout widths risked drifting screen to screen as the build progressed.
No external frameworks or libraries permitted — no Bootstrap, Tailwind, React, or third-party chart/modal packages allowed anywhere in the build
Concurrent multi-window modals risked z-index stacking bugs and frozen UI states without a custom focus-tracking system
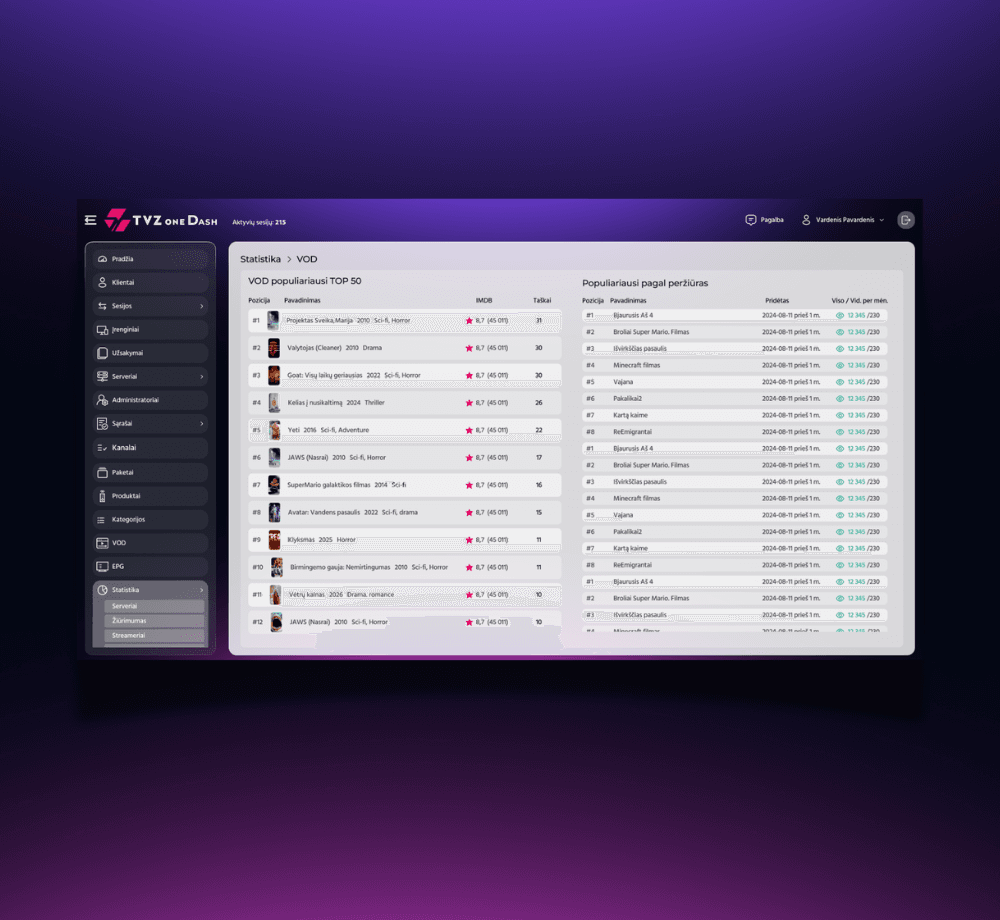
Data visualizations (bar charts, line graphs, pie charts) had to be computed and rendered from raw arrays using pure JavaScript, with no charting engine to fall back on
Responsive data tables across dozens of distinct Figma-specified layouts needed to avoid the typical mobile collapse of dense admin tables
60 screens of UI risked style drift without a centralized theming system for fonts, colors, spacing, and layout widths
Authentication, CRUD data mutation, and device/channel/VOD management all needed to feel reactive despite running on vanilla DOM logic with no state library
Collapsible cards, drag-and-drop modals, and multi-tab filters all needed smooth native transitions without relying on animation libraries
Our Collaboration
Phase 1
Discover
Phase 2
Build
Phase 3
Deliver



The project began with a client-provided Figma file covering all 60 screens, followed by a deep style audit to abstract every global UI value into a native CSS custom-property matrix before any component code was written.
Key Activities
Client-Provided Figma Ingestion
Worked directly from the client's comprehensive Figma design file, mapping every screen and component ahead of development.
Global Style Audit
Audited font hierarchies, line heights, colors, and layout widths across all 60 screens to abstract them into a Native CSS Variables Matrix.
Modal & Chart Math Research
Researched drag-and-drop event tracking mechanics and percentage-based data-to-pixel conversion ahead of building the native modal and charting engines.
Responsive Table Strategy
Planned multiple distinct table styles per Figma spec to prevent the typical collapse of dense data tables on smaller viewports.
Delivered
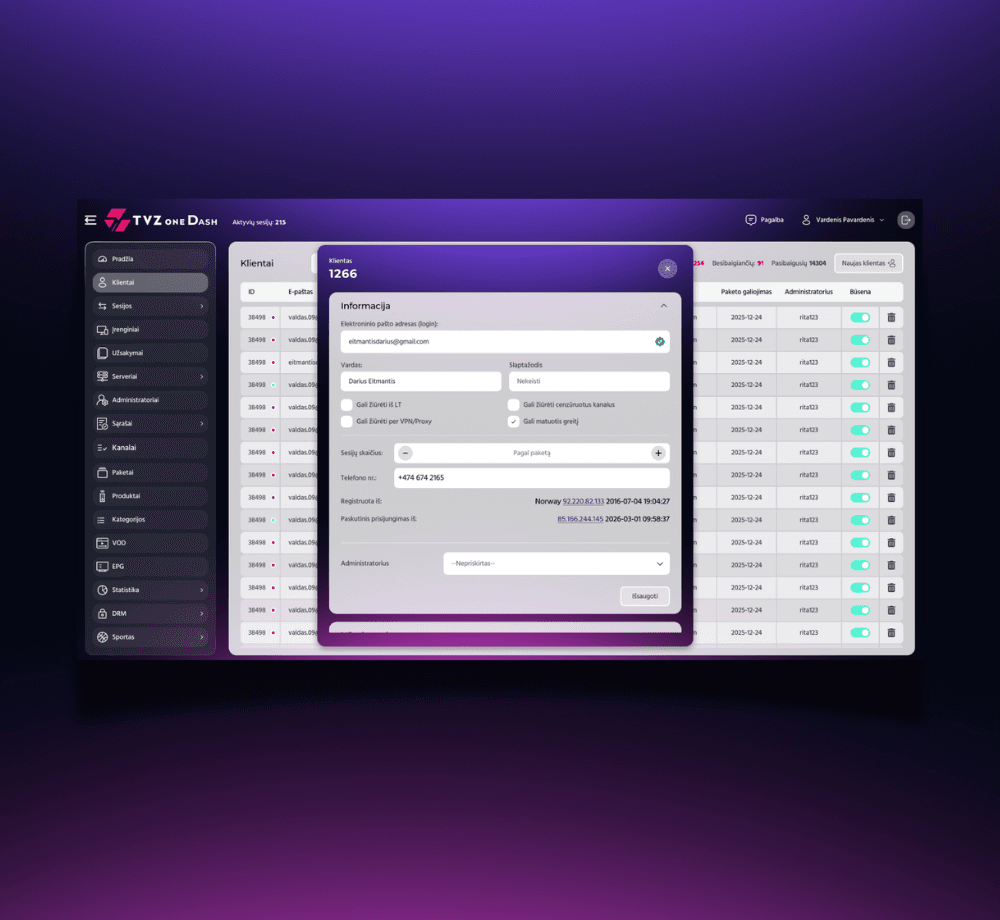
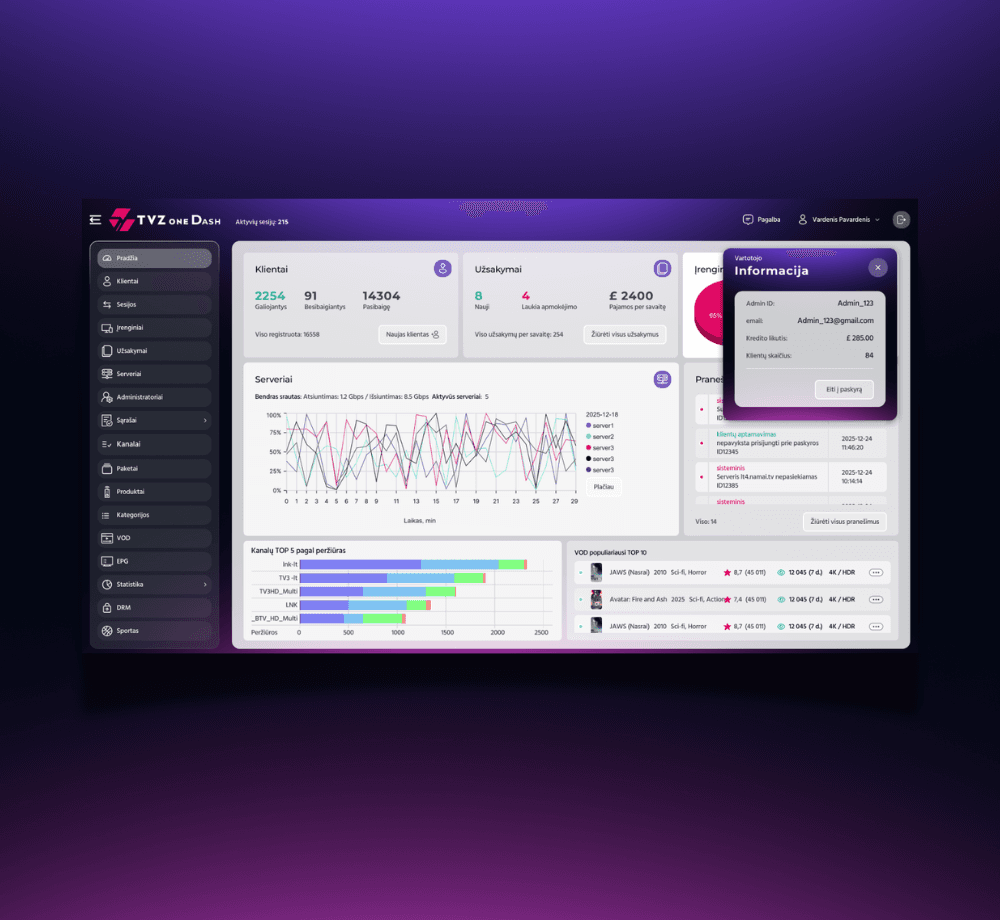
Native Multi-Modal Window System
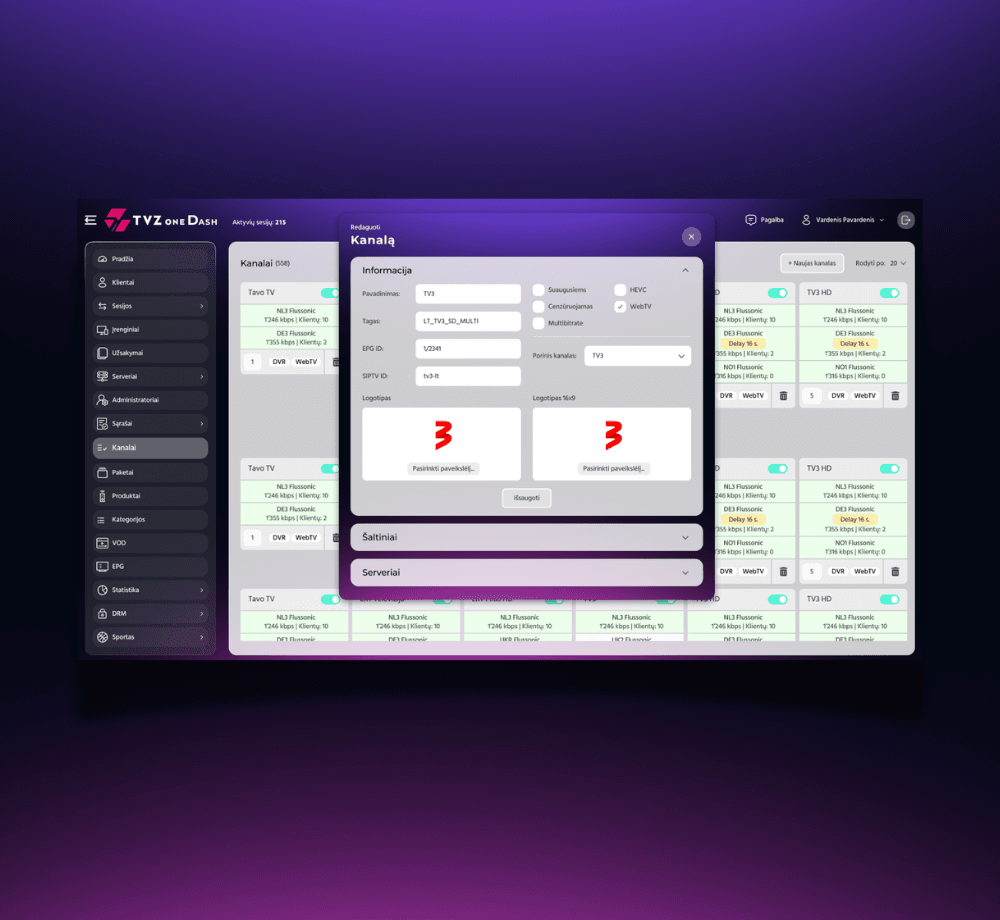
A custom drag-and-drop modal engine supporting concurrent open windows with correct focus-based z-index stacking, built entirely without a UI library.
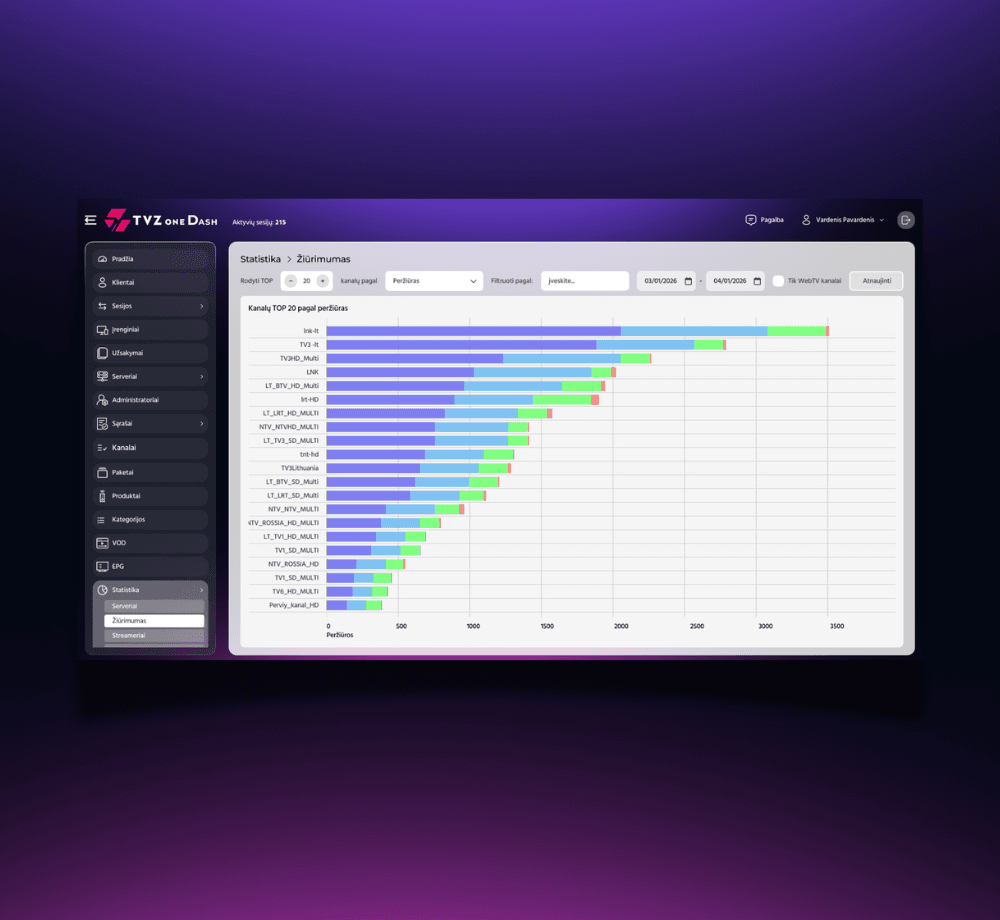
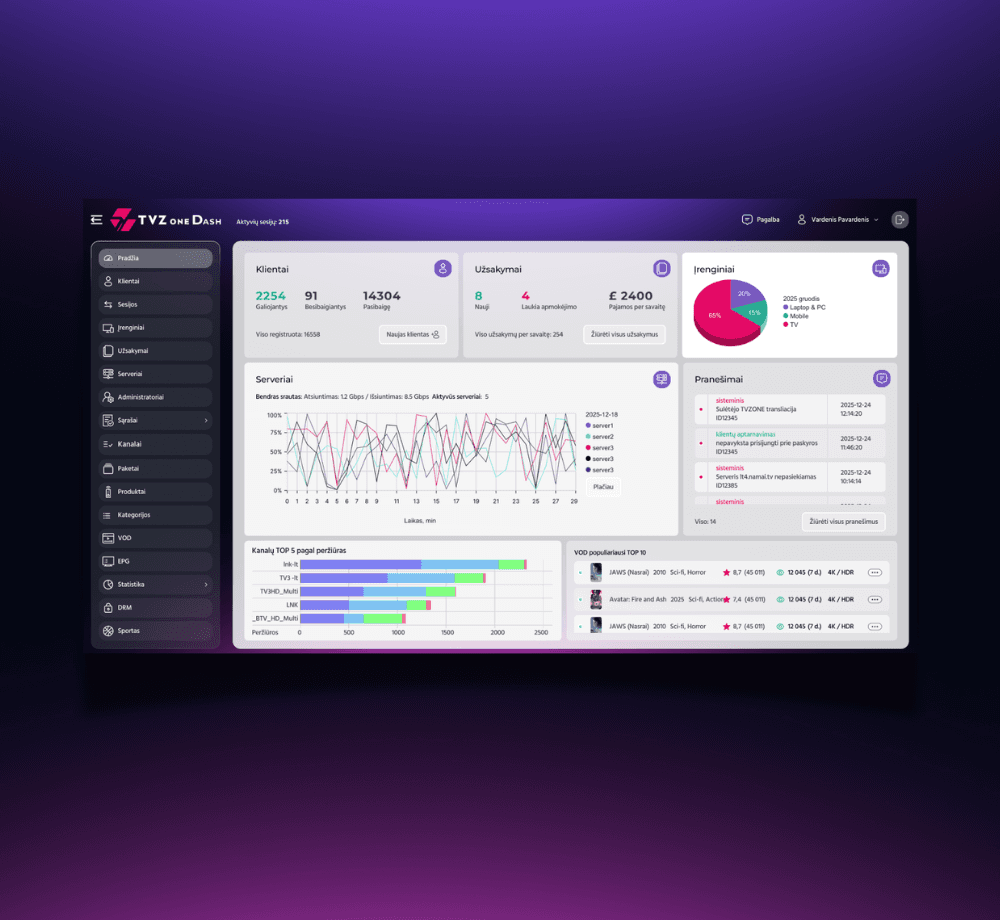
Hand-Coded Analytics Engine
Bar charts, line graphs, and pie charts computed from raw data arrays in pure JavaScript, complete with real-time interactive hover tooltips.
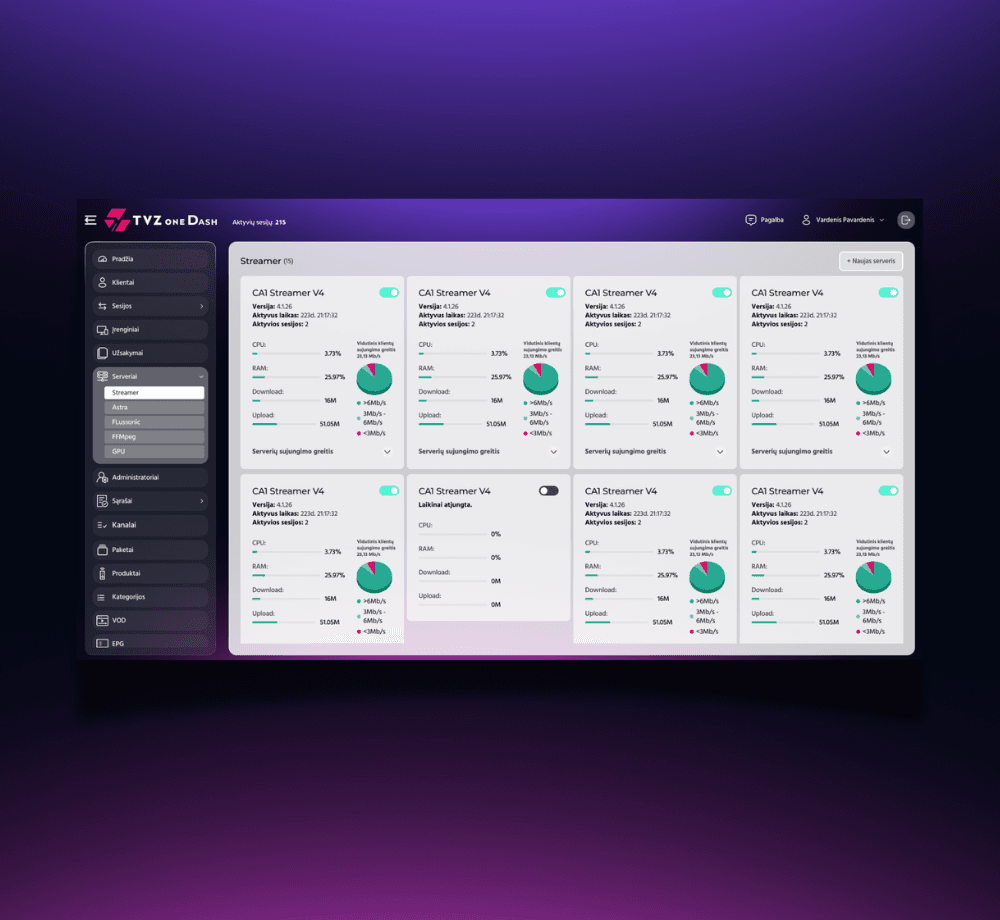
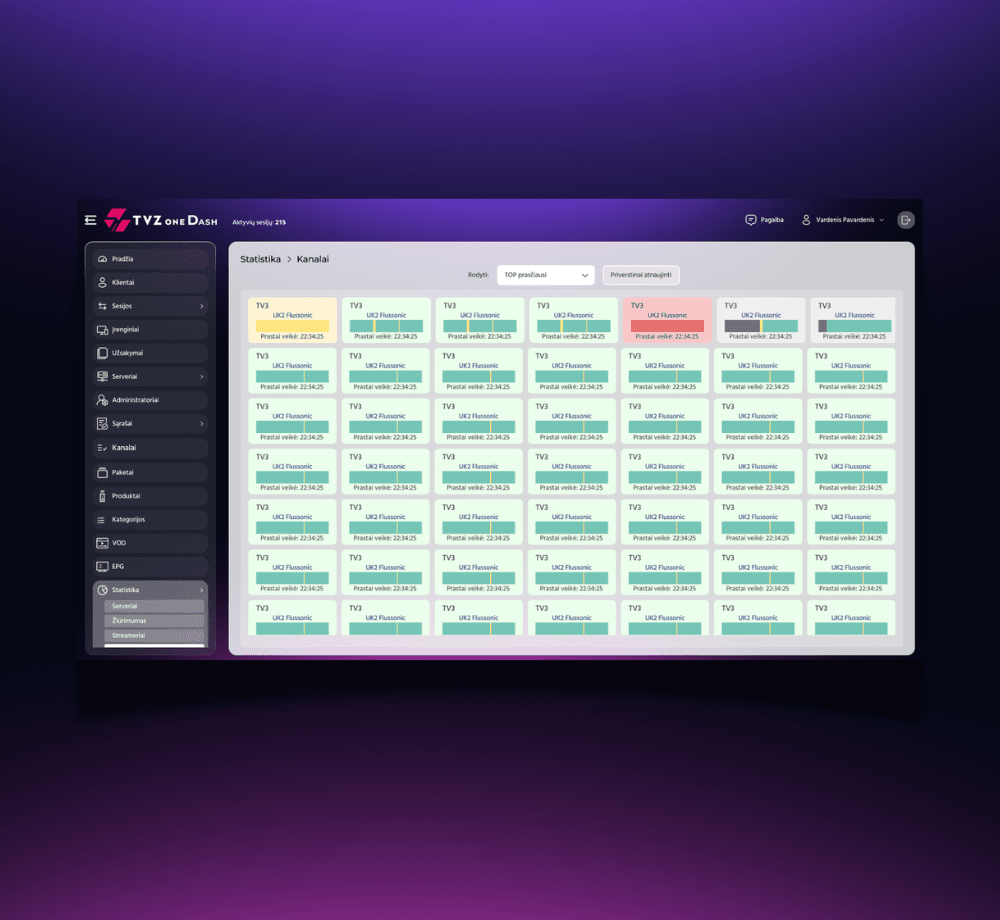
Live Infrastructure Monitoring
Real-time server, channel, and session health grids with color-coded status indicators and one-click enable/disable controls.
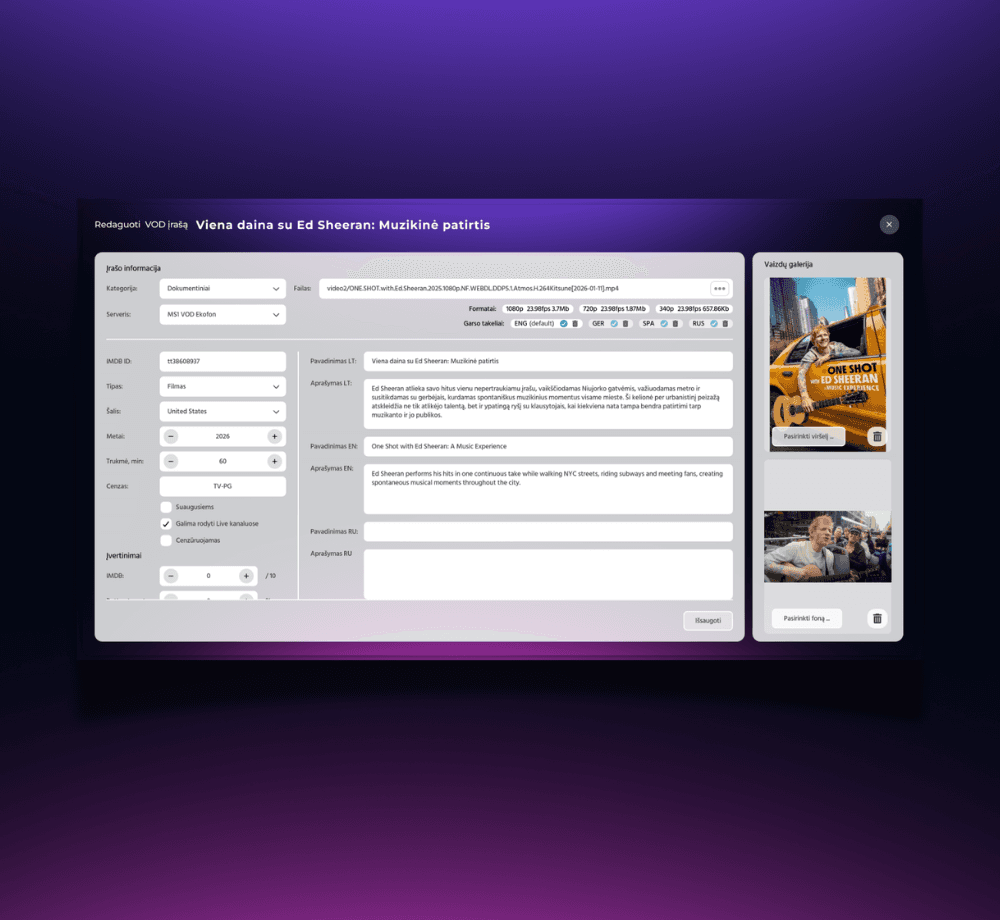
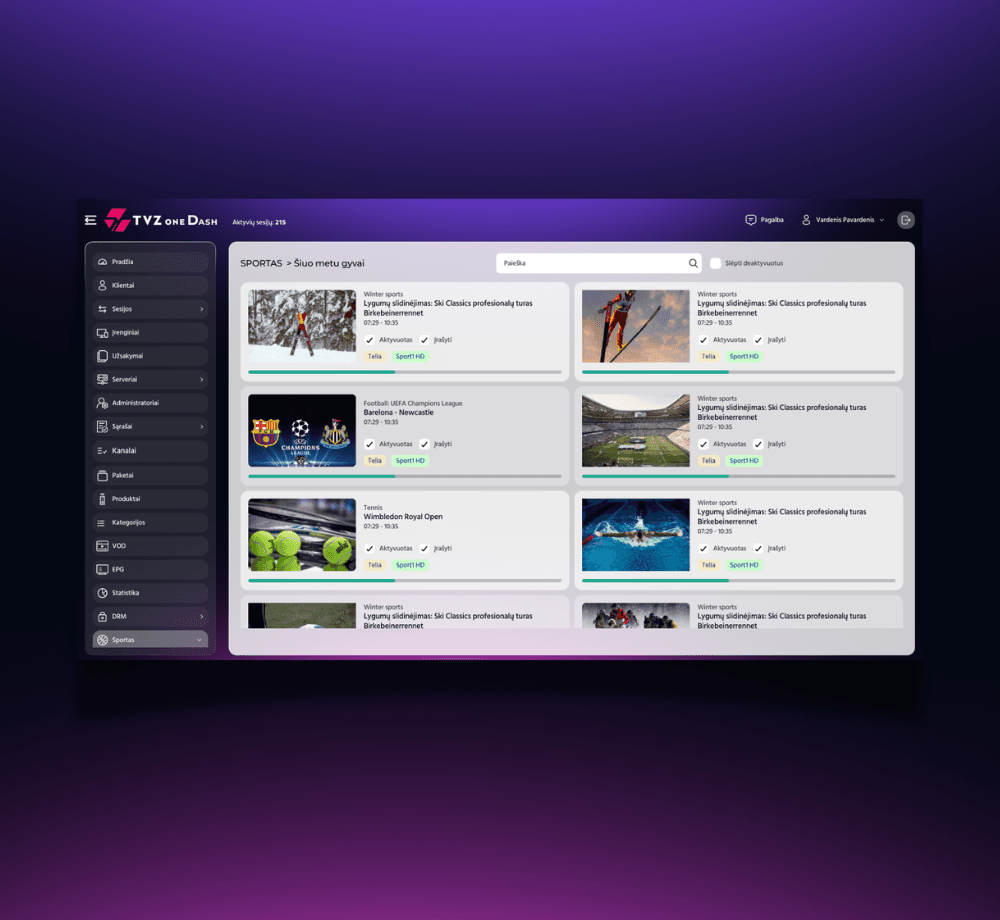
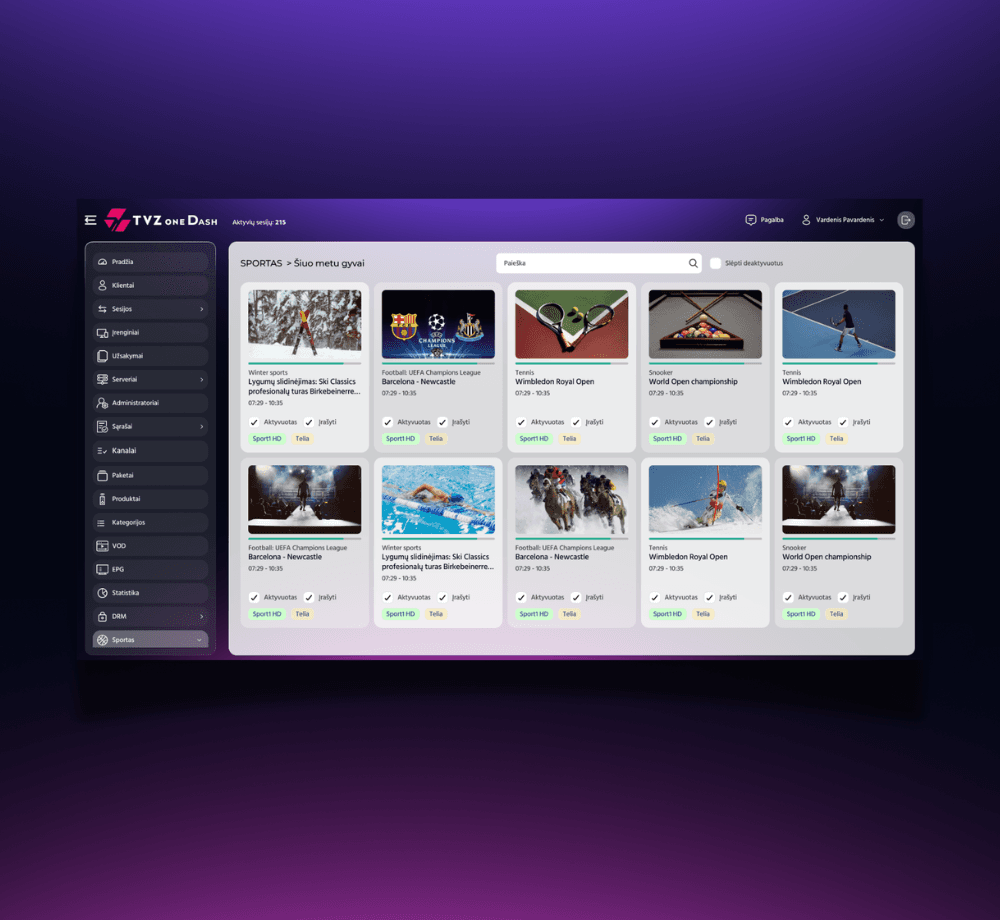
Full IPTV/VOD Content Management
End-to-end CRUD tooling for channels, VOD records, devices, and client permissions, including multilingual metadata and logo uploads.
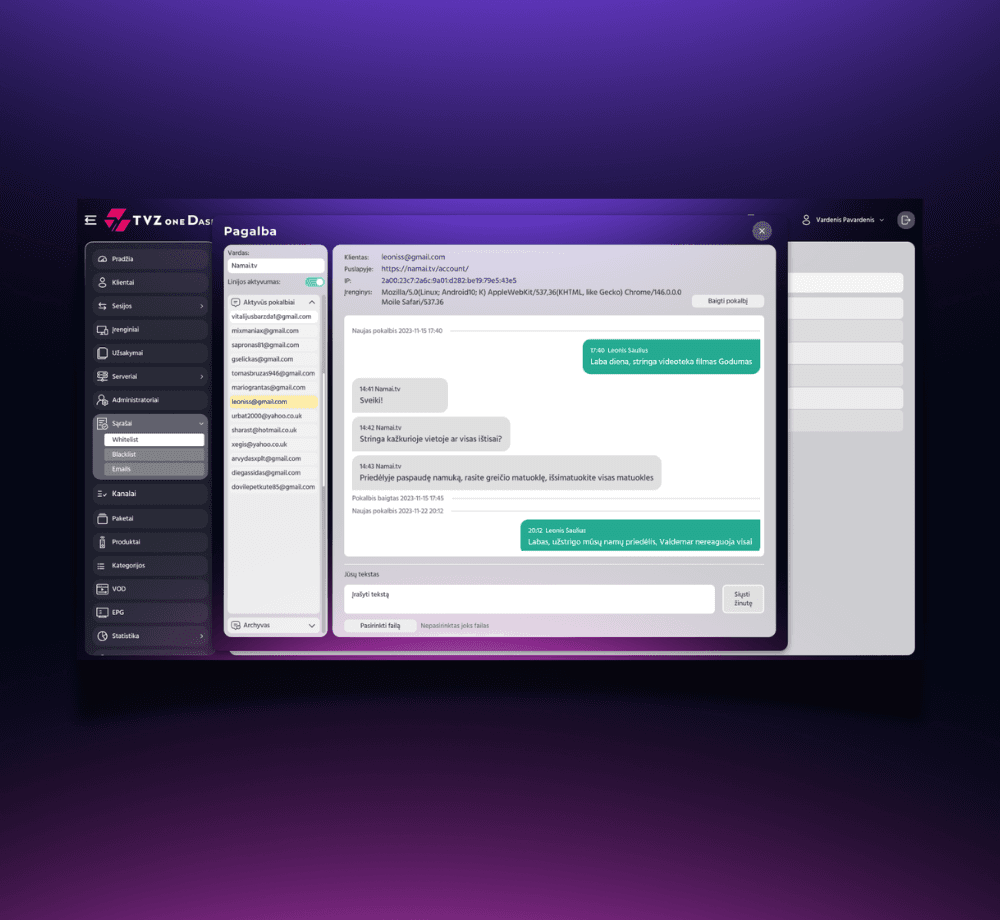
Native Live Support Console
A built-in threaded chat interface for client support, complete with device fingerprinting and conversation archiving.
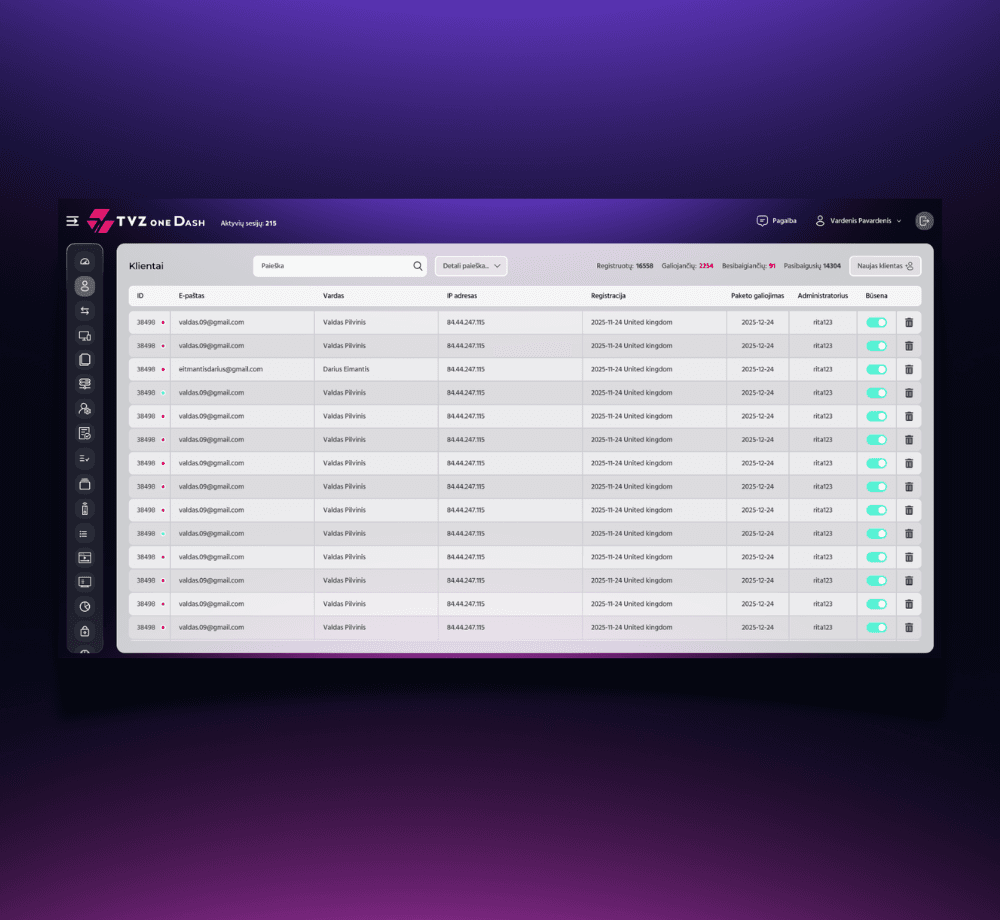
Responsive Figma-Perfect Tables
Multiple purpose-built responsive table layouts translated pixel-for-pixel from Figma, tuned to avoid mobile collapse on dense datasets.
Gallery
Build with:


“
Perfect execution in translate our Figma project to real html. Freelancer even added additional features missing from Figma to elevate our project into a new level. 10/10 will order again for our next projects.
— Mb H.
This project is part of our web development work. Discover how we can deliver tailored solutions for your business.